Certain car models are statistically more likely to be involved in accidents, with the Subaru Crosstrek topping the list as the most crash-prone vehicle, according to a recent study by insurance comparison site, AutoInsurance.com. The study analyzed over two million insurance quotes to determine which vehicles have the highest accident claim rates.
Subaru Crosstrek Leads List of Accident-Prone Vehicles
The AutoInsurance.com study, which scrutinized a substantial sample of insurance quotes, identified the Subaru Crosstrek as the vehicle with the highest percentage of accident claims. This data suggests that drivers of this model are statistically more likely to be involved in collisions compared to other vehicles on the road. While the study highlights correlation, it does not explicitly establish causation. Factors such as driver demographics, driving habits, and the environments where these vehicles are commonly driven could all contribute to the higher accident rates. The data serves as a valuable tool for consumers, insurers, and safety advocates alike.
Top 10 Most Accident-Prone Vehicles
The complete list of the top 10 most crash-prone vehicles, based on the AutoInsurance.com analysis, is as follows:
- Subaru Crosstrek
- Nissan Versa
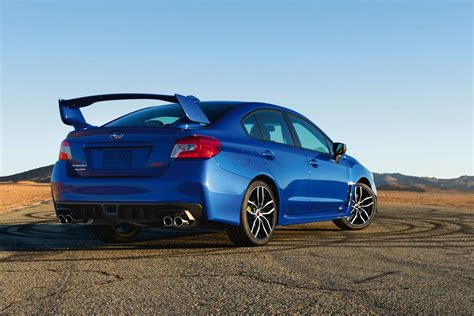
- Subaru WRX
- Hyundai Accent
- Kia Rio
- Nissan Sentra
- Mazda 3
- Hyundai Elantra
- Honda Civic
- Toyota Corolla
The list includes a mix of subcompact and compact cars, indicating that vehicle size and class might play a role in accident statistics.
Factors Contributing to Accident Rates
It is crucial to understand that a vehicle being on this list does not automatically imply that it is unsafe or poorly designed. Accident rates are influenced by a complex interplay of factors, including:
-
Driver Behavior: Aggressive driving, distracted driving (texting, using a phone), speeding, and driving under the influence are major contributors to accidents, regardless of the vehicle being driven.
-
Vehicle Type and Size: Smaller vehicles, such as many on the list, may offer less protection in a collision compared to larger, heavier vehicles. However, they are often more affordable and popular among younger or less experienced drivers, who may be statistically more likely to be involved in accidents.
-
Demographics: The age, gender, and experience level of drivers can significantly impact accident rates. Younger drivers, in particular, tend to have higher accident rates due to inexperience and riskier driving habits.
-
Driving Environment: Vehicles that are frequently driven in urban areas with heavy traffic, or in regions with challenging weather conditions (snow, ice, rain), may be exposed to a higher risk of accidents.
-
Vehicle Use: How a vehicle is used can also influence accident rates. For example, vehicles used primarily for commuting during rush hour might be more prone to accidents than vehicles used mainly for leisure travel on weekends.
Expert Insights and Analysis
While the AutoInsurance.com study provides valuable data, it’s important to consider expert opinions and analysis to gain a more comprehensive understanding of the issue.
According to industry safety experts, “It’s essential to look beyond just the vehicle model and consider the broader context of driver behavior and environmental factors.”
The Insurance Institute for Highway Safety (IIHS) and the National Highway Traffic Safety Administration (NHTSA) conduct extensive crash testing and safety ratings of vehicles. While their ratings focus on how well a vehicle protects its occupants in a crash, the AutoInsurance.com study focuses on the frequency of accidents, regardless of the severity.
The Role of Insurance Data
Insurance companies collect and analyze vast amounts of data related to accidents. This data is used to assess risk and determine insurance premiums. The AutoInsurance.com study leverages this type of data to identify vehicles with higher-than-average accident claim rates.
“Insurance data provides a real-world perspective on accident trends,” says a representative from AutoInsurance.com. “By analyzing millions of insurance quotes, we can identify patterns and trends that might not be apparent from other sources.”
Implications for Consumers
For consumers, the AutoInsurance.com study offers valuable insights to consider when purchasing a vehicle. While safety ratings from organizations like IIHS and NHTSA should be a primary consideration, the accident claim data provides an additional layer of information.
If you are considering purchasing a vehicle on the list, it is essential to be aware of the potential for higher accident rates and to take extra precautions to drive safely. This might include taking defensive driving courses, being extra vigilant behind the wheel, and ensuring that the vehicle is properly maintained.
Beyond the Top 10: Safety as a Whole
It’s also important to remember that even vehicles not on this list can be involved in accidents. No vehicle is completely accident-proof, and driver behavior remains the single most important factor in preventing accidents.
Prioritizing safety features, such as automatic emergency braking, lane departure warning, and blind-spot monitoring, can help reduce the risk of accidents, regardless of the vehicle being driven.
The Impact of Advanced Driver-Assistance Systems (ADAS)
The increasing availability of Advanced Driver-Assistance Systems (ADAS) in modern vehicles is expected to have a significant impact on accident rates in the future. These systems use sensors and technology to assist drivers with tasks such as braking, steering, and lane keeping.
Studies have shown that ADAS features can significantly reduce the likelihood of accidents. For example, automatic emergency braking systems can help prevent or mitigate rear-end collisions, while lane departure warning systems can alert drivers if they are drifting out of their lane.
As ADAS technology becomes more widespread, it is likely that accident rates will decline overall, potentially altering the list of most accident-prone vehicles in the years to come.
Geographic Considerations
Accident rates can also vary significantly by geographic location. Factors such as population density, traffic patterns, and weather conditions can all influence the likelihood of accidents. For example, vehicles driven in urban areas with heavy traffic may be more prone to accidents than those driven in rural areas with less traffic. Similarly, vehicles driven in regions with frequent snow or ice may be more likely to be involved in accidents during the winter months. Therefore, it is important to consider your local driving environment when evaluating accident statistics.
The Role of Vehicle Maintenance
Proper vehicle maintenance is another crucial factor in preventing accidents. Regularly servicing your vehicle, including checking tire pressure, brake function, and fluid levels, can help ensure that it is operating safely and reliably. Neglecting vehicle maintenance can increase the risk of mechanical failures, which can lead to accidents. For example, worn tires can reduce traction and increase the risk of skidding, while faulty brakes can impair the vehicle’s ability to stop quickly.
Future Trends and Predictions
As technology continues to evolve, the automotive industry is likely to see even more advanced safety features and driver-assistance systems in the future. These innovations have the potential to further reduce accident rates and improve overall road safety. For example, self-driving cars, which are currently under development, could eventually eliminate human error as a cause of accidents. However, it is important to note that these technologies are still in their early stages, and it may take many years before they are widely adopted.
The Importance of Data-Driven Insights
The AutoInsurance.com study underscores the importance of data-driven insights in understanding and addressing road safety challenges. By analyzing large datasets of insurance claims, researchers can identify patterns and trends that might not be apparent from other sources. This information can be used to inform policy decisions, improve vehicle design, and educate drivers about safety risks. As data collection and analysis techniques become more sophisticated, it is likely that data-driven insights will play an increasingly important role in promoting road safety.
Counterpoints and Considerations
While the AutoInsurance.com study provides a valuable perspective, it’s crucial to acknowledge its limitations. The study relies on insurance claim data, which may not capture all accidents. Accidents that are not reported to insurance companies, such as minor fender-benders, are not included in the analysis. Additionally, the study does not account for the severity of accidents. A vehicle may have a high accident rate but a low rate of serious injuries or fatalities. Therefore, it is important to interpret the study’s findings with caution and to consider other sources of information, such as safety ratings from IIHS and NHTSA.
The Influence of Marketing and Sales
The popularity and marketing of specific vehicle models can also influence their accident rates. Vehicles that are heavily marketed to younger or less experienced drivers may be more likely to be involved in accidents, simply because they are driven by a higher proportion of drivers in those demographics. Similarly, vehicles that are marketed as sporty or performance-oriented may attract drivers who are more likely to engage in risky driving behaviors.
The Human Element
Ultimately, the human element remains the most significant factor in road safety. Regardless of the vehicle being driven or the safety features it offers, drivers must prioritize safe driving practices. This includes avoiding distractions, obeying traffic laws, driving at safe speeds, and never driving under the influence of alcohol or drugs. By taking personal responsibility for their actions behind the wheel, drivers can significantly reduce the risk of accidents and make the roads safer for everyone.
Conclusion: A Multi-Faceted Approach to Safety
The AutoInsurance.com study provides valuable insights into the vehicles that are statistically more likely to be involved in accidents. However, it is important to remember that accident rates are influenced by a complex interplay of factors, including driver behavior, vehicle type, driving environment, and vehicle maintenance. To improve road safety, a multi-faceted approach is needed that addresses all of these factors. This includes educating drivers about safe driving practices, improving vehicle safety standards, investing in safer infrastructure, and promoting the development and adoption of advanced driver-assistance systems. By working together, we can make the roads safer for everyone.
FAQ: Frequently Asked Questions
-
Does being on this list mean my car is unsafe?
No. The list indicates a higher frequency of accidents, not necessarily that the car is inherently unsafe. As stated in the original article, “It’s essential to look beyond just the vehicle model and consider the broader context of driver behavior and environmental factors.” Factors like driver demographics, driving habits, and where the car is driven can all contribute.
-
What data was used to compile this list?
The list was compiled by AutoInsurance.com based on an analysis of over two million insurance quotes. This data reflects the number of accident claims associated with different vehicle models. “Insurance data provides a real-world perspective on accident trends,” says a representative from AutoInsurance.com. “By analyzing millions of insurance quotes, we can identify patterns and trends that might not be apparent from other sources.”
-
How can I reduce my risk of an accident, even if my car is on the list?
Focus on safe driving habits. Avoid distractions, obey traffic laws, maintain a safe following distance, and never drive under the influence. Consider taking a defensive driving course. Ensure your vehicle is properly maintained.
-
Do safety ratings from IIHS and NHTSA contradict this list?
Not necessarily. IIHS and NHTSA ratings focus on how well a vehicle protects its occupants in a crash, while this list focuses on the frequency of accidents, regardless of severity. A car can be safe in a crash but still be involved in accidents more often. These are complementary, not contradictory, pieces of information.
-
Will ADAS (Advanced Driver-Assistance Systems) affect this list in the future?
Potentially, yes. ADAS features like automatic emergency braking and lane departure warning are designed to prevent accidents. As these technologies become more widespread, they could lead to a decrease in accident rates and potentially change the ranking of vehicles on this type of list in the future.
-
Are specific demographics more prone to accidents in the listed vehicles?
The study doesn’t explicitly break down accident rates by demographic within each vehicle model. However, it’s generally understood that younger, less experienced drivers tend to have higher accident rates, and if certain vehicles are more commonly driven by this demographic, it could contribute to the higher accident rate for that model. Further research would be needed to establish a definitive link.
-
How do driving conditions such as urban vs rural impact this list?
Driving conditions absolutely play a role. Vehicles frequently driven in dense urban areas with heavy traffic and frequent stops are exposed to more potential accident scenarios than vehicles primarily driven on open rural roads. This environmental factor contributes to the overall accident rate for specific models.
-
Does the study account for miles driven per vehicle?
The article doesn’t explicitly state whether the study normalizes the data for miles driven. If the data isn’t adjusted for mileage, vehicles driven more frequently would naturally have a higher probability of being involved in an accident, even if their safety record per mile is comparable to other vehicles. This is a limitation to consider when interpreting the data.
-
How can I find out more about the methodology of the study?
Contact AutoInsurance.com directly. The article provides the source of the study, and reaching out to them is the best way to obtain more details about their methodology, data collection, and analysis techniques.
-
Is this list a definitive guide for choosing a safe car?
No. This list is one data point to consider. Prioritize safety ratings from IIHS and NHTSA, research the safety features of any vehicle you are considering, and most importantly, commit to safe driving practices. This list highlights accident frequency, not inherent vehicle safety in a crash.